
Tuesday, March 13, 2007
Monday, March 12, 2007
Stock Buybacks

Net issuance of equities (new issues minus buybacks) by non-farm US corporations has reached a record -$602 billion, a fourteen-fold increase in net corporate buybacks since 2003, financed by a record assumption of $437 billion in new debt. Is it any wonder that the S&P 500 bottomed out in 2003 and has been rising since ?
Friday, March 09, 2007
Subprime Loan Implosion

 Fed Governor Susan Bies says sub-prime defaults are "the beginning of the wave"
Thursday, March 08, 2007

Friday, March 02, 2007
Return of the Yen , and the unwinding of the Yen-Carry Trade

After the Bank of Japan raised overnight rates 25bp's , from 0.25% to 0.50% , we should have figured that there would be some rally in the Yen , and with it an unwinding of the "Yen-carry trade" . As the "carry" currency for hedge funds and proprietary trading desks , any change in rates and/or the underlying currency , would bring on some unwinding of " funding " positions .... and didn't it do a job on the markets this week !!!!
Japan's Nikkei 225 Stock Average lost 5.3 percent in the past five days, its worst weekly performance since June . Hong Kong's Hang Seng fell 7 percent , its longest losing streak in 17 months . China's Shanghai and Shenzhen 300 Index fell 9% Tuesday .
European stocks had the worst week since the beginning of the four-year bull market in October of 2002 . The Dow Jones Stoxx 600 Index , a basket of 600 European stocks , fell 5.2% for the week .
In the US , the S&P 500 fell 4.4 % , the Dow lost 4.2%, and the Nasdaq dropped 5.9%.
In Latin America , the Morgan Stanley Capital International index of Latin American shares fell 8.5 percent for the week .
Emerging market debt , measured by the Emerging Market Bond Index , widened to 189 bps above US Treasurys vs. the all-time record low 154 bp's set just a week ago on February 22 .
In the commodity world , Gold fell $45 to $644/oz. and Silver fell $1.45 to $13.28/oz. So much for their "safe haven" status ....

Monday, February 26, 2007

Friday, February 23, 2007
Corn --- off to the races ?


Corn is in the grips of the same investment fund-driven speculative mania that has engulfed many other commodities over the last few years. While the mania looks to continue in the short run, I suspect a major top in corn will occur this year , as I sense the frenzy nears a crescendo
Thursday, February 22, 2007
Vietnam -- The next Bubble to burst ???

The Vietnam Opportunity Fund provides an interesting glimpse into the rising interest in Emerging Market equities. The massive uptick in volume over the past few months, has accompanied both a strong rise in the underlying equities, and also in the currency , the dong ..... the Vietnamese Stock Index(VNINDEX) is up 227% over the past 12 months , and is up 40% so far in 2007 .
Other Emerging Markets are on a tear as well ----- an index of 22 so-called frontier countries rose 12% in January, the fastest-ever start to a year. Five of them, including Vietnam, Ukraine and Croatia, are among this year’s top 10 markets
Monday, February 05, 2007

Wednesday, January 31, 2007

Friday, January 19, 2007

Wednesday, January 17, 2007

Tuesday, January 16, 2007

Saturday, January 06, 2007
Commodity Currencies

In the last 9 months we've seen some very sharp drops in two major commodities, oil and copper . Oil has fallen from $78/bbl to $56/bbl. , and Copper has dropped from $4.05/lb. to $2.60/lb. . One of the ramifications of a commodity drop is the influence that it holds on a Commodity-based economy's currency . As commodity prices rise , more currency is needed to buy it and in turn the currency rises ..... and as the commodity's price falls , less currency is needed , thus putting downward pressure on that "commodity currency " . A great example of this is the Canadian Dollar which has seen its value fall from 91-cents to 85-cents in the last five months . Examinations of the Australian Dollar , New Zealand Dollar and South African Rand have also exhibited the same negative action
Friday, January 05, 2007
TLT --- Head and Shoulders ???
 TLT .... the 10-year Treasury Note ETF ( proxy for debt markets) looks as if it may be setting up for a Head-and-Shoulders pattern with yields rising ( and thus prices falling )
Thursday, January 04, 2007

Friday, December 29, 2006
Shares outstanding contracting --- The Buyout and Merger effect

"... shares outstanding in the U.S. contracted by at least $600 billion this year -- roughly 3.1% of the market's total value, according to TrimTabs."The U.S. equity market hasn't shrunk by that much in at least a decade. In 2005, the market contracted by roughly 2% and by less than 0.1% in 2004, TrimTabs estimates. From 1999 through 2003, the market expanded every year. (Percentages are based on the market capitalization of the U.S. equity market at the end of each year.)"

DJ Industrials priced in Gold (inflation's still alive)
Who says there's no inflation ??? Look at the Dow Jones Industrials' performance priced in Gold instead of the $ ....
When priced in gold rather than dollars, the Dow was down 5.7% in 4Q 2006, down 3.3% for the 2006 year, and down 53% since the peak in 2000
 ....
When priced in gold rather than dollars, the Dow was down 5.7% in 4Q 2006, down 3.3% for the 2006 year, and down 53% since the peak in 2000
Friday, December 22, 2006

Wednesday, December 13, 2006

Monday, December 11, 2006

Friday, December 08, 2006
GDP --- Developed economies
3Q GDP #'s have been reported for most major economies , and while there will be revisions to these figures as more data comes in , here are the preliminary figures so far :
US +2.0%
Japan +0.8%
UK +0.7%
Germany +0.6%
France +0%
Italy +0.3%
Spain +0.9%
Canada +1.8%
US +2.0%
Japan +0.8%
UK +0.7%
Germany +0.6%
France +0%
Italy +0.3%
Spain +0.9%
Canada +1.8%
Wednesday, November 29, 2006
Comeback of Crude

WTI Light Crude just crossed over its 50-Day moving average and is poised to attempt a rally to its 200-day m.a.
Monday, November 27, 2006
$$$$

Should we really believe that the $ won't hold the same importance in world trade in the future that it does now ...... that the Euro will displace it .... that the Chinese and Japanese will diversify their foreign holdings by selling more $'s and instead buy the Euro

S&P500 Earnings : Now vs. Then
This chart illustrates S&P 500 earnings per share and price over the past several years: observe how much higher EPS is than the last time the index was at 1400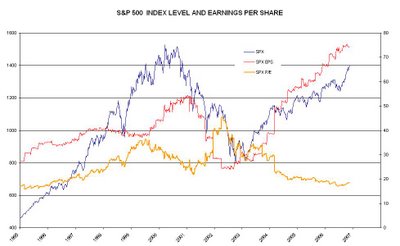

Wednesday, November 22, 2006

Monday, November 20, 2006
Stock Options
 This chart shows the average stock price movements 30 days before and 30 days after the awarding of 7,786 option grants to the CEOs of 1,970 companies between 1996 and 2005
Sunday, November 19, 2006
3Q S&P 500 Earnings report card : A+
 S&P 500 profit growth for the third quarter came in around 20% versus a long-term historical average of 7%, according to Thomson Financial. This marks the 17th straight quarter of double-digit profit growth, the best streak since recording keeping began in 1936.... another great quarter for corporate America and for equities
Saturday, November 11, 2006

Tuesday, November 07, 2006

Friday, October 27, 2006

Monday, October 23, 2006

Thursday, October 19, 2006

Sunday, October 15, 2006


Thursday, September 28, 2006
Rate Cuts ???
On the back of the most recent weak economic numbers ( GDP only 2.6% in 2Q , Durable Goods Orders -0.5% in August , Housing Prices falling for the first time in 11 years , etc. ) , the Bond market is starting to price in the possibility of Rate cuts as soon as the 1Q of 2007 . Additionaly , the implied rates are even starting to price in the possibility of a second rate cut by next August

Wednesday, September 27, 2006
Large Caps / Small Caps
For the better part of the past 6 years the places to be in equities have been Mid- and Small -cap stocks . They have clearly ourperformed their larger cap brethren . Since January 1 , 2000 , the Russell Large Cap Index has returned an annualized 0.77% / year while the Russell Small Cap Index has returned 3.65% /year , and the Russell Mid-Cap Index has returned 8.62%/year .
The pundits have called for Large Caps to start to outperform for quite a while now , to no avail , but things may start to change as the Large/Small cap chart is indicating
 Mid-Cap Index has returned 8.62%/year .
The pundits have called for Large Caps to start to outperform for quite a while now , to no avail , but things may start to change as the Large/Small cap chart is indicating
Friday, September 22, 2006
Killing Commodities


Liquidity is the key driver in all financial markets and when Central Banks decide to pour it on ( or turn off the spigot ) the ramifications are felt almost immediately . Commodities , which thrive on leverage in the futures markets , can see extreme movements , and this past summer was no exception as a series of rate tightenings and monetary directives conspired to break the back of most commodities .
Demand and Supply are usually forefront in measuring all asset classes , but liquidity has a very heavy hand
Thursday, September 14, 2006
Oil Inventories


 As we have witnessed over the last 6 weeks , crude oil has fallen from $78/bbl . down to $63/bbl , a rapid decline and a major factor leading to the rally in Equities and Bonds . While we are happy to see retail gas prices falling from $3/gallon to $2.55/gallon at the pump , we shouldn't get overly optimistic that oil continues to fall towards $40/bbl. anytime soon.
This week the IEA cut worldwide Oil demand to 84.7 Million bbl./day for the balance of 2006 , down from a previous estimate of 84.8 Million bbl./day made last May , and its 2007 daily Oil estimates was cut by 160 Thousand to 86.2Million bbl. /day --- not exactly huge declines . Recently OPEC cut worldwide demand estimates as well , also by token accounts .OPEC, which controls 40% of the world's crude, opted to keep its production quota at 28 million barrels per day to help lower prices and has maintained that level since July 2005 . For 2006 , OPEC expects demand growth in the U.S. to grow by only 90,000 barrels per day. In 2005, growth jumped by 230,000 barrels per day and in 2004 the growth was 520,000 barrels per day .
The increase of supply output , prospects of new Oil reserves in the GofM , and no Hurricane-related dislocations , have kept Crude and Gasoline prices under enormous pressure recently . BUT , that doesn't necessarily mean that the Demand side of the equation is fully eliminated . The U.S. consumer is still "addicted" to oil and Chinese demand is not going anywhere soon .
One way to look at the supply side is Total Oil crude and products in inventory which points to relatively high levels , but a better gauge to look at is the supply in storage needed to cover existing demand . In 1991 we had approximately 65 days of supply to cover demand , but in 2006 the supply is down to a lower level of 50 days supply to cover daily demand .
Don't throw away your bicycle just yet
Put / Call ratios

The Put/Call ratio measures the trading volume of put options to call options. It is an indicator which measures sentiment in the Options markets and thus can be used to gauge investor sentiment in the underlying Equity markets . As an example , a high volume of puts compared to calls indicates a bearish sentiment in the market , and vice versa .
It's believed by many market practitioners that certain extreme levels in the Put/Call ratio are good determinants of forecasting future market direction . A very high Put/Call level would indicate too much Bearish sentiment and would point to a reversal Bull rally in the market . Conversely , a low P/C level could point to an ensuing market sell-off .
On days when the major averages perform strongly, the number of calls bought typically far outweighs the number of puts. On these days, greed prevails and the P/C ratio may be very low -- perhaps in the neighborhood of 0.70/1 . On days of deep market weakness, however, fear prevails and the number of puts purchased is generally far greater than calls -- possibly reaching 1.5/1 . While 1/1 might seem to be a neutral reading, usually more calls than puts trade on an "average" day. As such, a reading of around 0.80 is about "normal" on this indicator.
The daily P/C line is very uneven and most measurements need to be plotted over a moving average to smooth out the raw data , usually an average period of 10 days .
With the market's recent rally over these past 2 months , can we discern anything from today's Put/Call level ? A cursory glance indicates that Puts are still relatively high and may allow for further gains in the S&P500 . The sentiment may still mean that investors are very suspicious and cautious of the recent rally .......
Tuesday, September 12, 2006
Housing Futures

One of the more innovative derivative instruments to be brought to market is the Housing Future . Trading began in May , with futures contracts targeted to housing-price indexes in 10 major metropolitan areas . The contracts are the brainchild of economists Robert Shiller of Yale and Karl Case of Wellesley ( S&P/Case-Shiller Home Price Indices ) and trade on the Chicago Mercantile Exchange .
The proposition is straight forward : if you spend $1 Million on a Manhattan apartment , and want to hedge against the risk that it might be worth $750 Thousand two years from now, you can sell contracts that will reap you a profit if local prices fall . Conversely , if you think housing will continue to boom you can place a bet that will pay off if prices keep rising .
The contracts may be better suited to large Home Builders or Institutional Investors and may not be easily collateralized , but Investors have a new tool to speculate and hedge with . If enough traders participate in the market, it could become a valuable predictor of housing prices in different cities .
With housing prices declining some and inventories building , the Housing Boom seems to have halted and/or " popped " . The futures markets are presently indicating expectations of price declines for contracts going out as far as August of 2007
Quadruple Witching

With this Friday's Quadruple Witching ( contracts for stock index futures, stock index options, stock options and single stock futures all expire ) right around the bend , investors should take advantage of the week's volatility in "closing out " In-the-money positions and begin rolling them into new October , November and December positions .
The phenomenon of a Quad Witching has sometimes been referred to as "Freaky Friday" as it leads to many counter trends throughout the week leading into the final day of expiration . Aggressive accounts , usually hedge funds , proprietary trading desks and commodity funds are the most active players during this period and they need to weigh and rebalance their portfolios as certain positions come to a close . As they step up their activities , they try to " play " the diminishing option and futures premiums , yet tend to all rush out the exit at the same time . This action brings on severe swings in price and leads to some dislocations.
In taking advantage of this week we should focus on Implied Volatility and judge whether or not a stock's options and futures are priced appropriately for a "roll" or if the positions should be allowed to expire .
Sunday, September 10, 2006
M1

Money Supply as measured by M1 is a good tool to follow in determining the path of interest rates , Debt markets and also future Fed actions
If we are to believe that "inflation is always and everywhere a monetary phenomenon" , then we should look not only at interest rates but at the amount of Dollars in circulation . The most recent figures from the St. Louis Fed point to a steep decline of M1 , even an outright contraction in percentage terms .
Why should we care that the Fed needs to fight inflation ? That age old question and its answers and ensuing arguments usually point to the loss of buying power .... in other words , with inflation, " stuff " , gets more expensive. Too much money chases too few goods , so prices are forced upwards .
These charts are self-explanatory , slowing money supply points to slowing economic growth ( maybe even recession ) , slowing inflation pressures , further weakening of commodity prices , further strength in the Treasury market with debt yields falling , and possible Fed rate decreases in 2007
Friday, September 08, 2006
Stocks vs. Commodities


The last 3 years have witnessed a huge move in commodities . The CRB index rose from 189 in 2002 to its all-time high of 367 this past May.... . Crude Oil rose to all-time highs of $78/bbl. .... Gold rose from $350/oz. in early 2003 to its most recent 25-year high of $732/oz ..... Copper rose to an all-time high of $4.04/lb. ..... Silver rose to 22-year highs of $15/oz , and the beat goes on and on and on ........
While the reflation of liquidity was a positive for Equities and Commodities in late 2002 , the current inflationary pressures have witnessed an outflow of money from Equities into Commodities and thus stocks have suffered for months and months .
Now we're witnessing a small shift which may or may not be the start of a new InterMarket flow of money . With the Fed on pause and seemingly in front of inflationary pressures , Bonds and Stocks have both rallied and Commodities have been under pressure . Most commodities are down 10% + from their highs while the Dow Jones Industrials are within 5% of their all-time highs .
Friday, September 01, 2006
Fed Funds

With the Bond market continuing its rally , we need to judge where rates will be in the future to make a judgement as to whether or not they are overbought / oversold . The inversion of the Treasury curve , with 2-year Treasurys yielding 4.80 , 5-year yielding 4.71% , 10-year yielding 4.76% gives us information as to what the market is estimating .
Another place to look is the Fed Funds market . The Fed Funds yield is presently 5.25% after the Fed halted rate increases at its August meeting , and the forward contract prices are indicating no upward moves over the next 6 months . In fact , they're even hinting at a possible rate cut early in 2007 . At present they imply a 50% chance of a cut to 5% by the April meeting . With inflation figures cooling -- especially the Fed's favorite inflation gauge , the PCE-deflator @ 0.1% in August -- Fed Funds futures are a good place to judge where Treasurys are heading.
Subscribe to:
Posts (Atom)